 by Sigbal
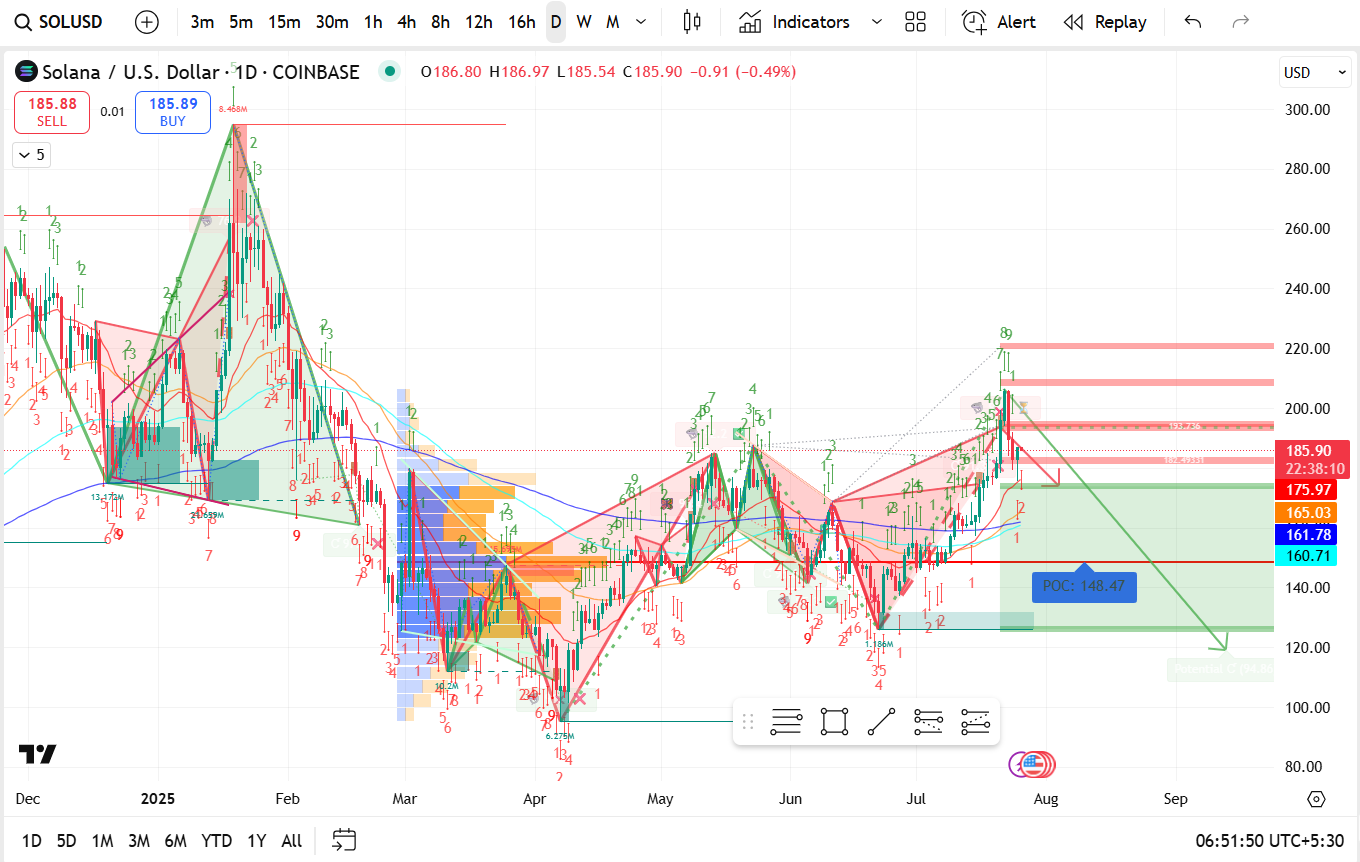
The wave count appears to show a completed 5-wave impulse up, topping around $210–$220, followed by a correction (Wave A) currently underway.
A major corrective phase (likely ABC) seems to be unfolding, potentially leading to lower support zones.
Price has rejected near the wave 5 peak and is currently in a downward move.
Multiple volume profile nodes and resistance zones have formed above current levels (highlighted in red).
The downward green arrow points to a target support zone between $120–$140, suggesting significant correction ahead.
| Level Type | Price (USD) | Comment |
|---|---|---|
| Current Price | 185.90 | Trading below recent highs |
| Resistance 1 | 200–220 | Strong overhead resistance (previous top) |
| Support 1 (POC Zone) | 148.47 | Point of Control – high volume area |
| Support 2 | 120–130 | Major correction target (green zone) |
| Immediate Support | 175.97, 165.03 | Local supports on breakdown path |
Volume Profile: Highest volume node near $148, marked as the POC (Point of Control).
Harmonic Patterns: Bearish patterns overlapping with Fibonacci clusters.
Trendlines: Breakdown from a rising wedge formation.
200-day EMA (blue line): Around $161–$165 zone, next major support.
Short-term Bias: Bearish, expecting a move toward $148, potentially further to $130–$120 if support fails.
Entry Idea: Watch for short setups if it loses $175 cleanly with volume.
Bullish Invalidation: Strong recovery and close above $200–$210.