 by Sigbal
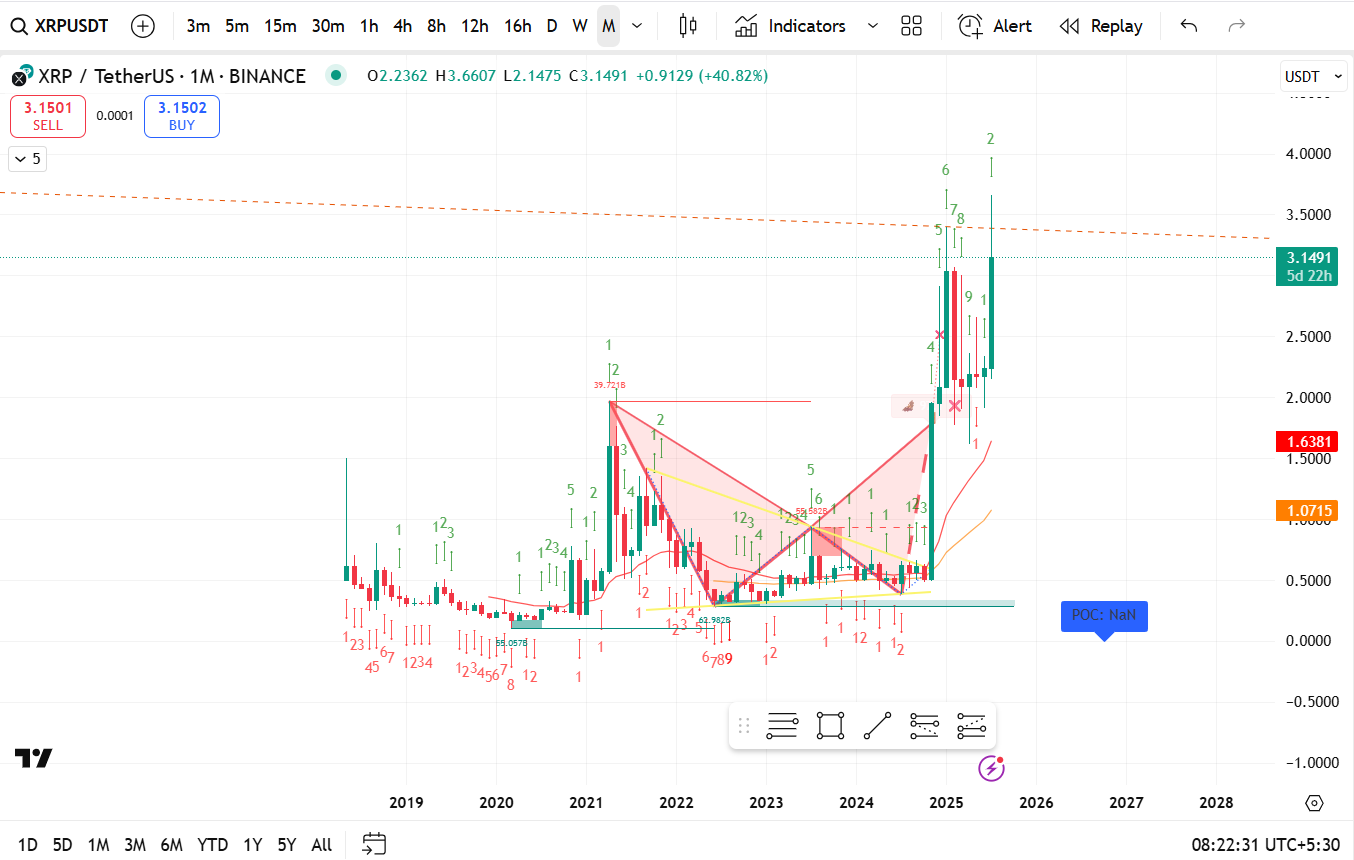
XRP has exploded from ~0.60 USDT to 3.66 USDT in just a couple of months.
Currently trading at $3.14, up +40% this month.
This is a multi-year breakout from a long-term consolidation range (~$0.2 to $1.3 since 2018).
A green “9” candle already completed — this is a classic trend exhaustion signal.
Currently forming a new green 2 candle in a new bullish sequence, but this can pause or pull back soon due to prior overextension.
A clear harmonic formation (possibly a bullish Bat or Gartley) was completed around mid-2024.
The breakout from this zone triggered the current rally — this confirms bullish macro structure.
Resistance appears near $3.60–$4.00 range (prior failed attempt from 2021-22).
The dotted orange line at ~$3.45–$3.60 may serve as a major resistance.
A break above $4.00 would likely lead to price discovery.
Key Support Areas:
$2.00–$2.20 → recent breakout zone.
$1.63 (red EMA) → historical resistance turned support.
$1.07 (orange EMA) → longer-term base zone.
| Scenario | Probability | Summary |
|---|---|---|
| 🔼 Bullish Expansion | 50% | If XRP breaks and closes above $3.60 on monthly chart, it could target $4.50–$5.20+ in next wave. This aligns with long-term Elliott Wave projections. |
| 🔄 Healthy Pullback | 35% | A re-test of $2.80–$2.20 area to reset indicators, then continuation. This would still be bullish long-term. |
| 🔻 False Breakout / Trap | 15% | Breakdown below $1.60 would invalidate bullish structure short term and retest $1.0–$1.3 support zone. Unlikely unless macro sentiment shifts drastically. |
| Indicator | Bullish Signal | Bearish Signal |
|---|---|---|
| Monthly Close | Above $3.60 | Below $2.80 |
| TD Sequential | Green 2–3 continuation | Red setup or stall at green 2 |
| Volume | Sustained increase | Sharp decline |
| RSI / MACD (not visible) | Above 70 but rising | Divergence or flattening |
Macro Structure: Extremely bullish breakout from 7-year consolidation.
Next target (if breakout continues): $4.50–$5.20.
Likely pullback zone (if cooling): $2.20–$2.80.
Long-term investors might use any retracement to $2.5–$2.2 as a strong buy-the-dip zone.