Crypto
Global Market
Indian Indices
About
Disclaimer
Menu
Search
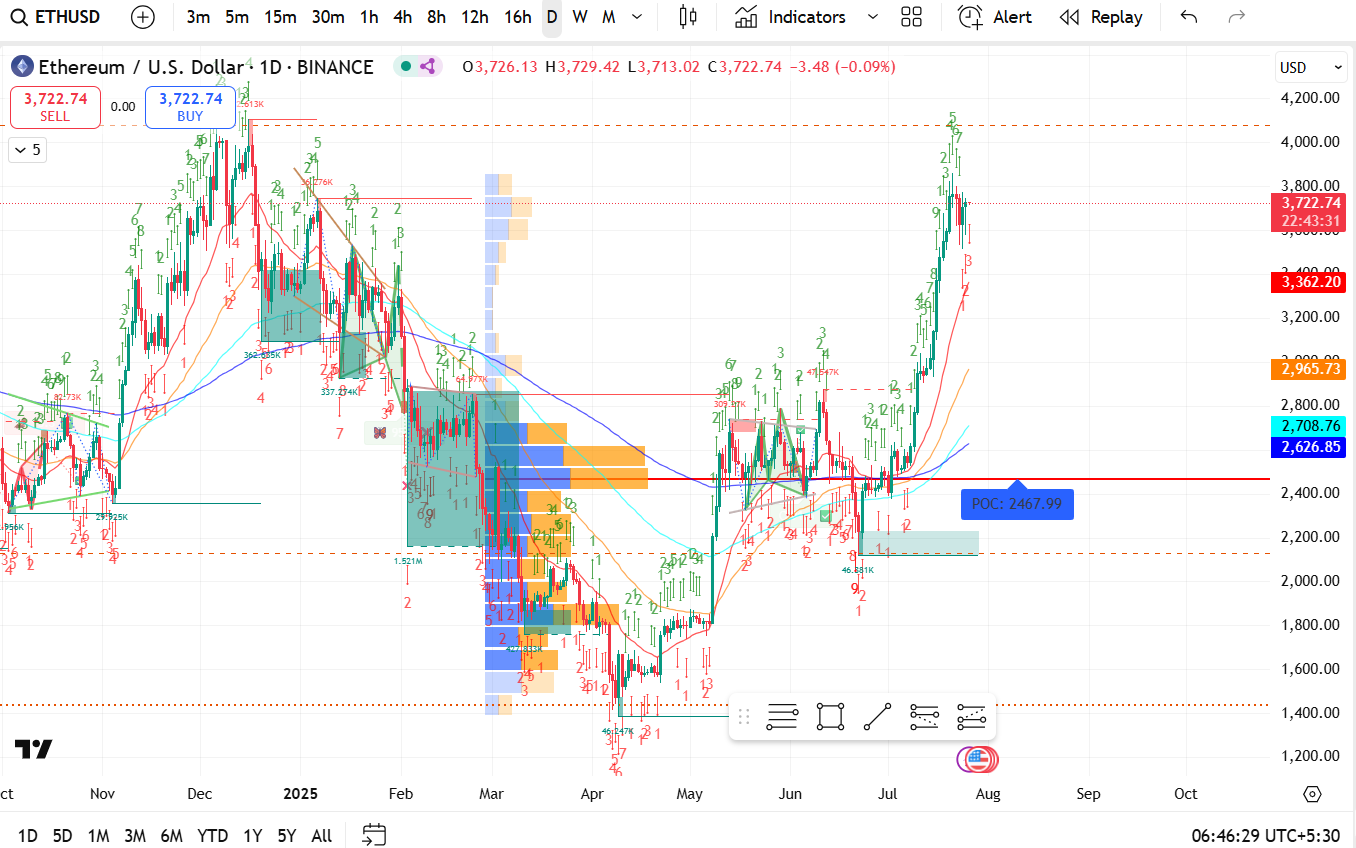
Ethereum (ETH /USD) Daily Analysis - Week 30, 2025
Jul 26, 2025
by Sigbal
Crypto
📊
Current Price
: $3,722.74
🔴
Slight dip
: -0.09% change on the day.
🧱
Volume Profile Insights
POC (Point of Control)
:
$2,467.99
This is the price level with the highest traded volume in the highlighted zone —
strong support
.
High Volume Nodes
: Around
$2,600 - $2,800
(Blue/Orange blocks).
Low Volume Gap
: Between
$3,000 and $3,300
, which was quickly cleared in the rally — often suggests
less resistance on retracements
through this area.
🌀
Elliott Wave Count (TD Sequential Style)
The chart shows completed
Wave 5
near the current top.
After Wave 5,
corrections (ABC)
are typical — potential pullback in sight.
📈
Moving Averages
🔵 200 EMA:
Around $2,626.85
🟠 50 EMA:
Around $2,708.76
These EMAs align with volume support zones →
confluence of support
in the
$2,600–$2,700
range.
🔁
Key Support Zones
Level
Significance
$3,362
Previous local top + support zone
$2,965
Fibonacci/EMA confluence
$2,708–2,626
50/200 EMA + Volume Profile HVN
$2,467.99
POC – Most accepted price historically
🚩
Risk Zones / Bearish Triggers
A breakdown below $3,362 could trigger a deeper correction toward $2,965 and then $2,700.
Break below $2,467 would be structurally bearish (trend reversal risk).
📉 Short-Term Outlook (Next 1–2 Weeks)
Bias
:
Mildly Bearish/Corrective
(Wave 5 peak + price stalling).
Watch for
pullback targets
: $3,362 → $2,965 → $2,708.
A strong bounce from $2,700s would reconfirm bullish momentum.
✅ Bullish Continuation Above:
If ETH breaks
above $3,800
, it may test
psychological resistance near $4,000–4,200
.
Share:
Facebook
X (Twitter)
Pinterest
LinkedIn
WhatsApp
Email
Copy link
 by Sigbal