 by Sigbal
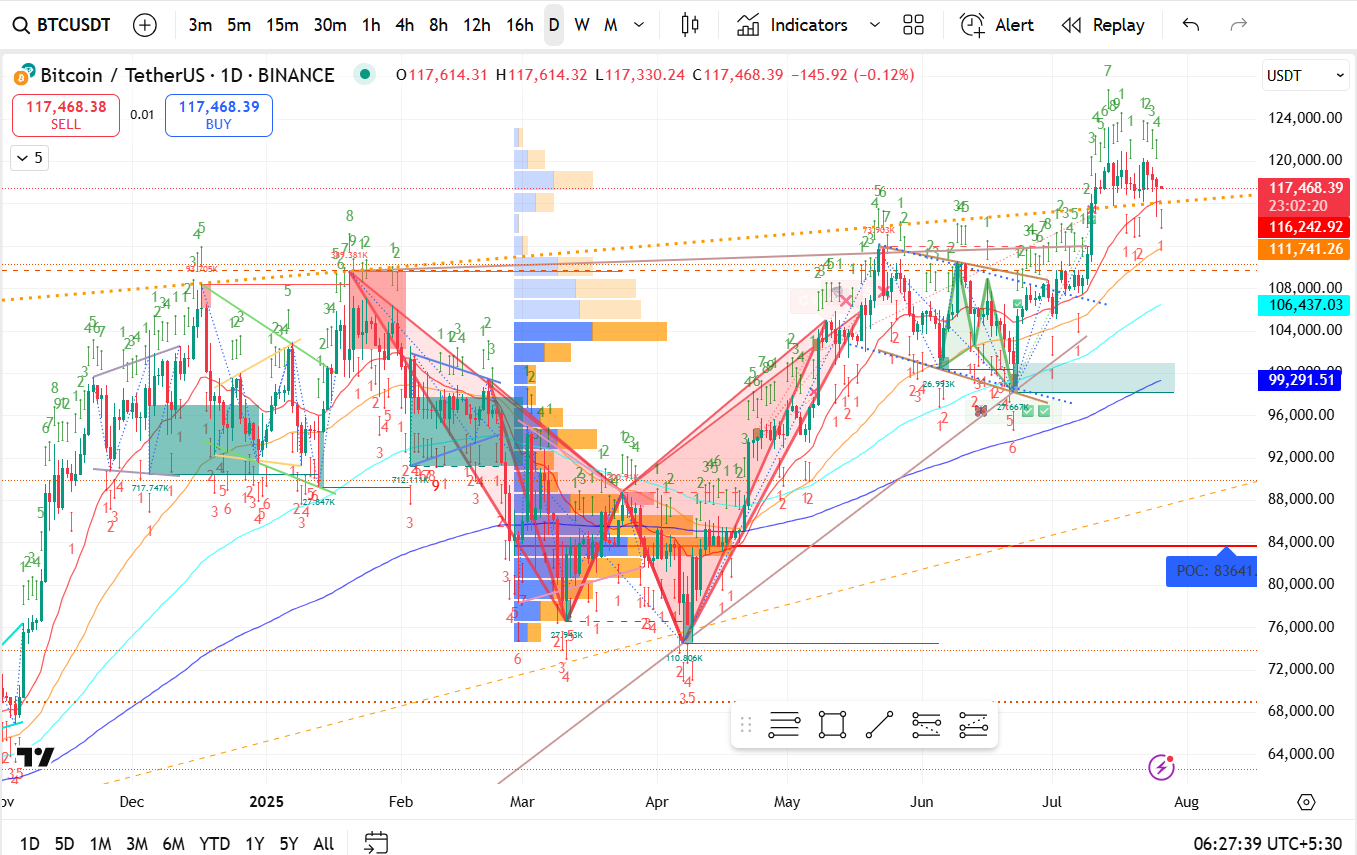
Current Price: ~$117,468
Last Close: Slightly negative (-0.12%)
Price has rejected from the recent high (~$124K) and is undergoing a correction.
Currently trading near the 23.6% Fib zone of the recent rally (assumed from pattern behavior).
POC (Point of Control) at $83,641 – shows strong historical volume support.
Heavy volume node also around $110K–$112K, acting as potential intermediate support.
116,242 USDT: Immediate support (from recent consolidation area).
111,741 USDT: Stronger support – previous breakout zone.
106,437 USDT: MA support zone.
99,291 USDT: 200 EMA – key long-term support.
83,641 USDT (POC): Major historical support.
120,000–124,000 USDT: Local top zone and potential double-top risk.
Strong psychological resistance near $125K.
The chart has TD Sequential indicators:
Recent TD Sell 9 and 13 triggered at the top (~$124K), indicating a potential reversal/correction.
Countdown restarting (currently at red 3), indicating short-term weakness.
Previous descending triangle breakout (Mar-Apr) confirmed bullish structure.
Elliott Wave structure visible – completed wave 5 with corrective wave A-B-C likely ongoing.
V-shaped recovery in March shows strong buying interest around $61K–$70K.
Price above all major moving averages.
50 EMA support is near ~$111–113K range.
200 EMA resting at ~$99.2K – critical support for long-term trend watchers.
| Factor | Sentiment |
|---|---|
| Short-term Momentum | Bearish to neutral (correction ongoing) |
| Medium-term Trend | Bullish |
| Long-term Structure | Strong uptrend intact |
| Risk if breaks below | $99,000 |
| Opportunity if holds | Bounce from $110K–113K zone |
Bounce from $111K–113K zone, reclaim $120K, and attempt breakout over $124K.
Breakout target: $130K–134K, extended wave 5 or new bullish impulse.
Breakdown below $111K, next support near $106K and then $99K (200 EMA).
Extended sell-off to POC at $83.6K possible if macro sentiment deteriorates.
We appear to have completed a 5-wave impulsive structure:
Wave 1: ~61K → 87K
Wave 2: Correction to ~70K
Wave 3: Extended rally to ~117K
Wave 4: Sideways/corrective to ~104K
Wave 5: Top at ~124K
This is likely the completion of a larger wave (1 or 3) of a higher degree.
Already may be unfolding: Top at $124K, now down to ~$117K
If confirmed, expect it to extend to $110K–$113K
Relief rally possible after A ends (~$113K area)
Likely bounce back to $119K–$121K (lower high)
Final correction leg
Potential target zones:
Strong support zone: $99K (200 EMA)
Worst-case: POC at $83,641
Fibonacci retracement targets:
38.2% = ~$104K
50% = ~$93K
61.8% = ~$83K (aligns with POC)
| Phase | Price Range | Expectation | Timeframe |
|---|---|---|---|
| Wave A | $124K → $110K | Ongoing drop | 1–2 weeks |
| Wave B | $110K → $119K | Short bounce | Early Aug |
| Wave C | $119K → $99K–$83K | Final deep correction | Aug–Sept |
$116K–117K: Immediate support
$110K–113K: Major intermediate support
$99K (200 EMA): Must-hold for long-term uptrend
$83.6K (POC): Worst-case full reset support