 by Sigbal
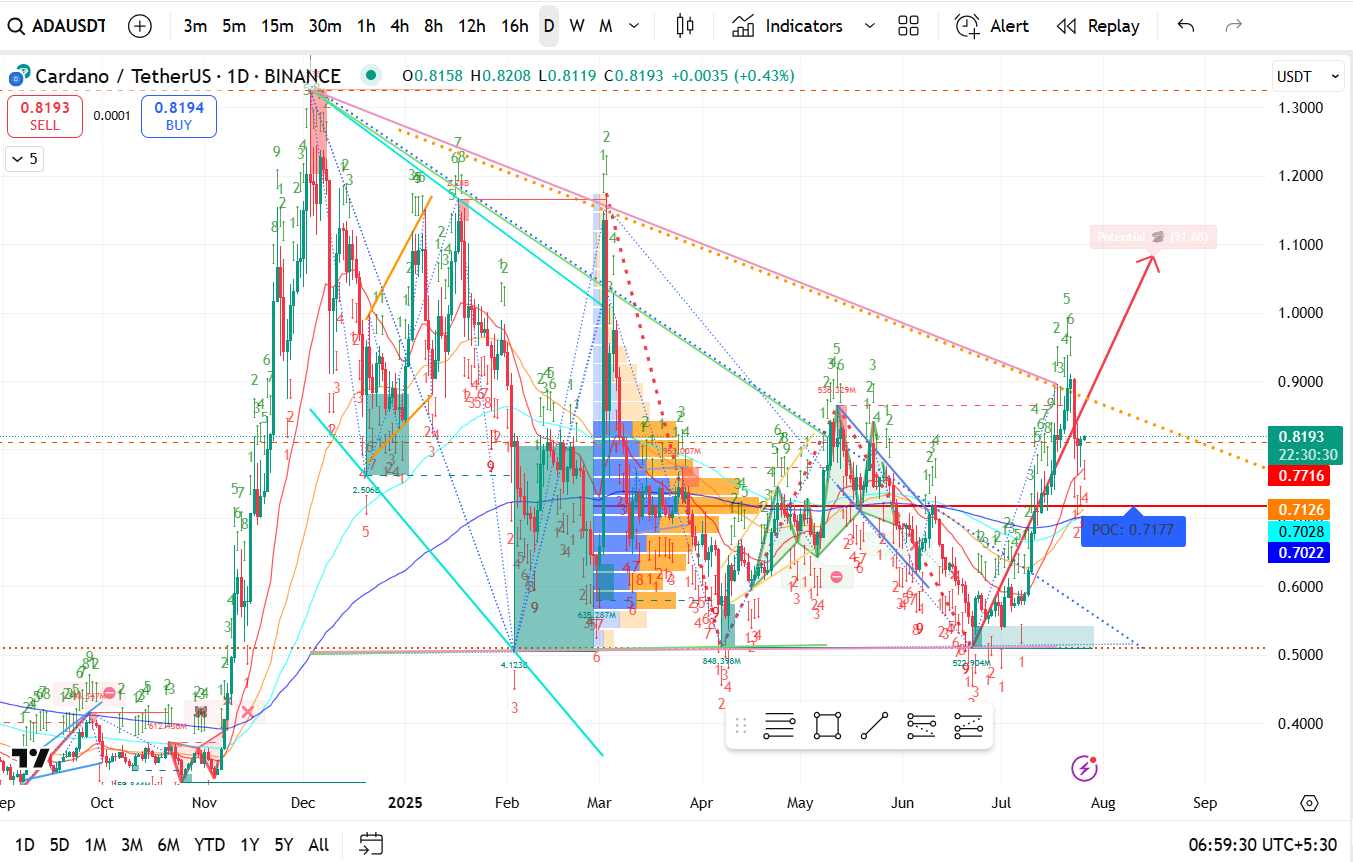
The chart we've shared is a Cardano (ADA/USDT) daily chart from Binance, containing a combination of Elliott Wave counts, trendlines, Volume Profile (POC), moving averages, and Fibonacci-based projections. Here's a breakdown of the technical analysis and future outlook:
$0.8193 — trading just above key resistance-turned-support levels.
POC (Point of Control) at $0.7177 → strong volume node; likely to act as support on retracements.
$0.7022 – $0.7177 → Strong support cluster including POC, horizontal support, and Fibonacci zones.
$0.7716 → minor support (previous resistance flip).
Immediate: Around $0.88–$0.92
Major resistance: Long-term descending trendline near $1.00 – $1.05
A bullish impulsive wave (1-2-3-4-5) seems to be unfolding.
Current structure hints Wave 3 completed, and possibly entering Wave 4 pullback before Wave 5 targets near $1.05–$1.10
Broken downward trendline from March 2025 shows a bullish breakout.
Red arrow points to a target zone near $1.05–$1.10 (Wave 5 potential).
200-day MA (blue) acting as dynamic support.
Price currently above all short- and mid-term MAs → bullish confirmation.
| Parameter | Value / Interpretation |
|---|---|
| Current Price | $0.8193 |
| Support Zones | $0.7177 (POC), $0.7022, $0.7716 |
| Resistance Zones | $0.88, $1.00–$1.10 |
| Trend Bias | Bullish (short to mid-term) |
| Next Target (Wave 5) | $1.05–$1.10 |
| Critical Stop-Loss | Below $0.70 (invalidates bullish setup) |
Cardano (ADA) shows a strong bullish structure, supported by volume profile and Elliott Wave formation. If the price holds above $0.7177, a continuation toward $1.05–$1.10 looks probable as part of a Wave 5 expansion.