Ripple (XRP/USD) Weekly Chart Analysis - Week 30, 2025

Ripple (XRP/USD) Weekly Chart Analysis - Week 30, 2025

  • Jul 26, 2025
  • Sigbal by Sigbal
  • Crypto

๐Ÿ“ˆ Current Market Overview

  • Current Price: 3.1402 USDT (Buy) / 3.1401 (Sell)
  • Price Change: -0.0021 (-0.07%)

๐Ÿ“Š Technical Indicators & Tools Used

  1. Elliott Wave Count (Red & Green Numbers):
    • Red numbers likely represent corrective wave counts.
    • Green numbers represent impulse waves.
    • A completed 5-wave impulse structure (green) seems visible on the right, indicating a possible end of a bullish cycle.
  2. Volume Profile (on left):
    • Shows volume traded at various price levels.
    • POC (Point of Control) marked near 2.00โ€“2.05 USDT, indicating a strong support area.
  3. Support/Resistance Zones:
    • Major Resistance Levels:
      • 3.1402 (current price/resistance)
      • 3.20โ€“3.25 (marked in red box)
    • Support Levels:
      • 3.03 (orange)
      • 2.69 (yellow)
      • 2.49 (blue)
      • 2.27 (deep blue)
  4. Moving Averages:
    • A blue line appears to be the 200-day MA (strong long-term support).
    • Price is currently well above itโ€”bullish trend continuation unless breakdown occurs.
  5. Harmonic Patterns:
    • Multiple patterns such as Gartley or Bat seem to be drawn.
    • Indicates potential reversal zones (X-A-B-C-D patterns).

๐Ÿ“Œ Key Observations

  • Strong bullish rally from May to July visible.
  • Short-term correction may be underway after reaching peak near 4.00.
  • If support at 3.03 or 2.69 holds, price may attempt a rebound.
  • A break below 2.49 or 2.27 may indicate deeper correction toward POC.

๐Ÿ”ฎ Trading Implications

  • Bullish Bias if price holds above 3.03 and reclaims 3.20+
  • Neutral to Bearish if price breaks below 2.69, heading toward POC
  • Watch for volume confirmation and RSI if available (not shown)

ย 

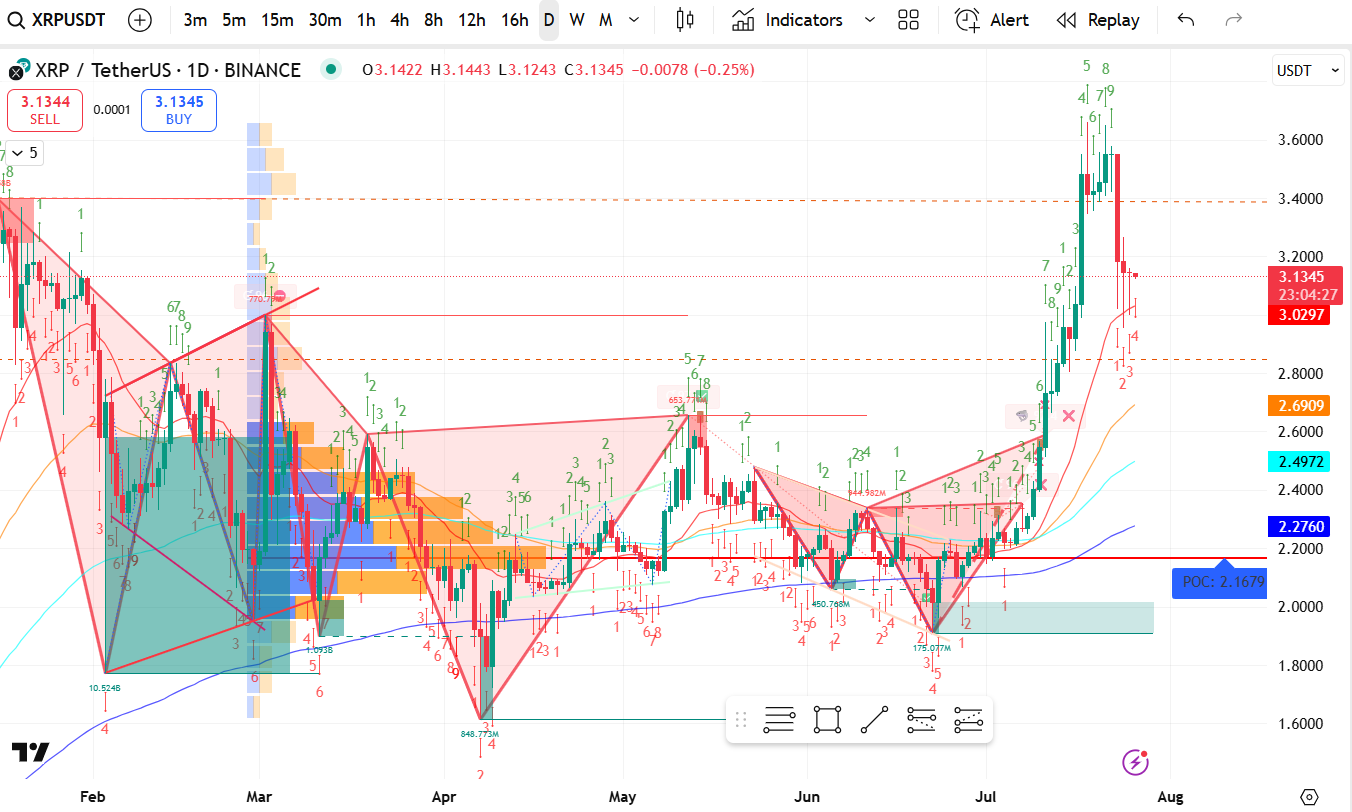
Based on the Elliott Wave structure visible in your XRP/USDT daily chart, here's a future price prediction analysis using standard Elliott Wave Theory:


๐Ÿ” Wave Count Analysis (from chart)

From the chart:

  • You appear to have completed a 5-wave impulse pattern up to ~4.00 USDT.

  • After a peak, there is now a sharp retracement, likely initiating a corrective wave (ABC).

This suggests:

  • Wave 1 to 5 was a bullish move from around ~1.00 USDT to ~4.00 USDT.

  • A Wave A correction may be underway now.

  • This will likely be followed by:

    • a Wave B (short-term bounce), then

    • a Wave C (deeper retracement) before new upward trend resumes.


๐Ÿ“‰ Predicted Corrective Move (ABC Pattern)

WaveTypeEstimated Target (based on Fibonacci + Chart levels)
ASharp dropโœ… Already in progress; likely to settle around 2.69โ€“2.49 USDT
BBounceLikely up to 3.10โ€“3.25 USDT (but weaker than previous high)
CFinal dropMay fall to strong support zone 2.20โ€“2.00 USDT (near POC)

After this ABC completes, a new impulse Wave 1 of a larger degree might begin if XRP fundamentals and macro remain positive.


๐Ÿ”ฎ Bullish Continuation Possibility

If XRP respects the 2.20โ€“2.00 support range and shows accumulation:

  • New Wave 1-5 projection (next cycle):

    • Wave 1: 3.20 USDT

    • Wave 2: retrace to 2.80

    • Wave 3: breakout to 4.50โ€“5.00 USDT

    • Wave 4: pullback to ~4.00

    • Wave 5: final move to 5.50โ€“6.00 USDT

๐Ÿ“Œ This would be medium-term (2โ€“6 months) if macro sentiment stays bullish and BTC doesn't collapse.


๐Ÿ“Š Key Support & Resistance Levels

LevelType
4.00โ€“4.50Major Resistance
3.25Local Resistance
2.69โ€“2.49Short-term Support
2.20โ€“2.00Strong Demand / POC

โš ๏ธ Warning

  • If XRP breaks below 2.00 USDT with volume, then Elliott count may need to be re-evaluated, and bearish structure may take over.

  • This entire prediction is valid only if XRP holds above the POC zone (around 2.00).

Share: