Ripple (XRP/USD) Weekly Chart Analysis - Week 29, 2025

Ripple (XRP/USD) Weekly Chart Analysis - Week 29, 2025

  • Jul 20, 2025
  • Sigbal by Sigbal
  • Crypto


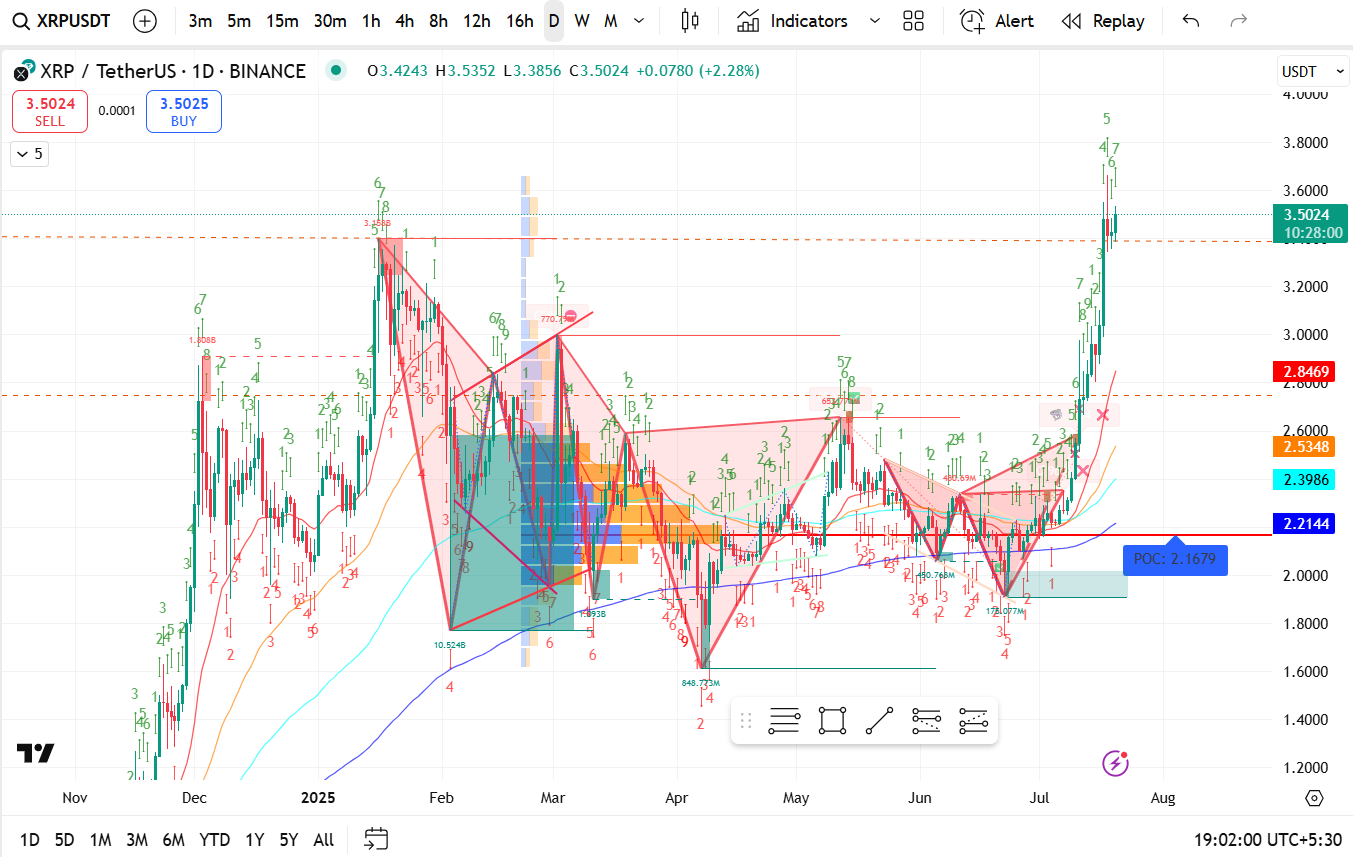
Looking at the XRP/USDT chart you provided (1D timeframe on Binance), here’s a concise technical analysis breakdown based on visible patterns and indicators:


🔍 Current Price & Trend

  • Current Price: $3.5061
  • Recent Move: Parabolic surge from ~$2.20 to ~$3.50 (approx. +59% move).
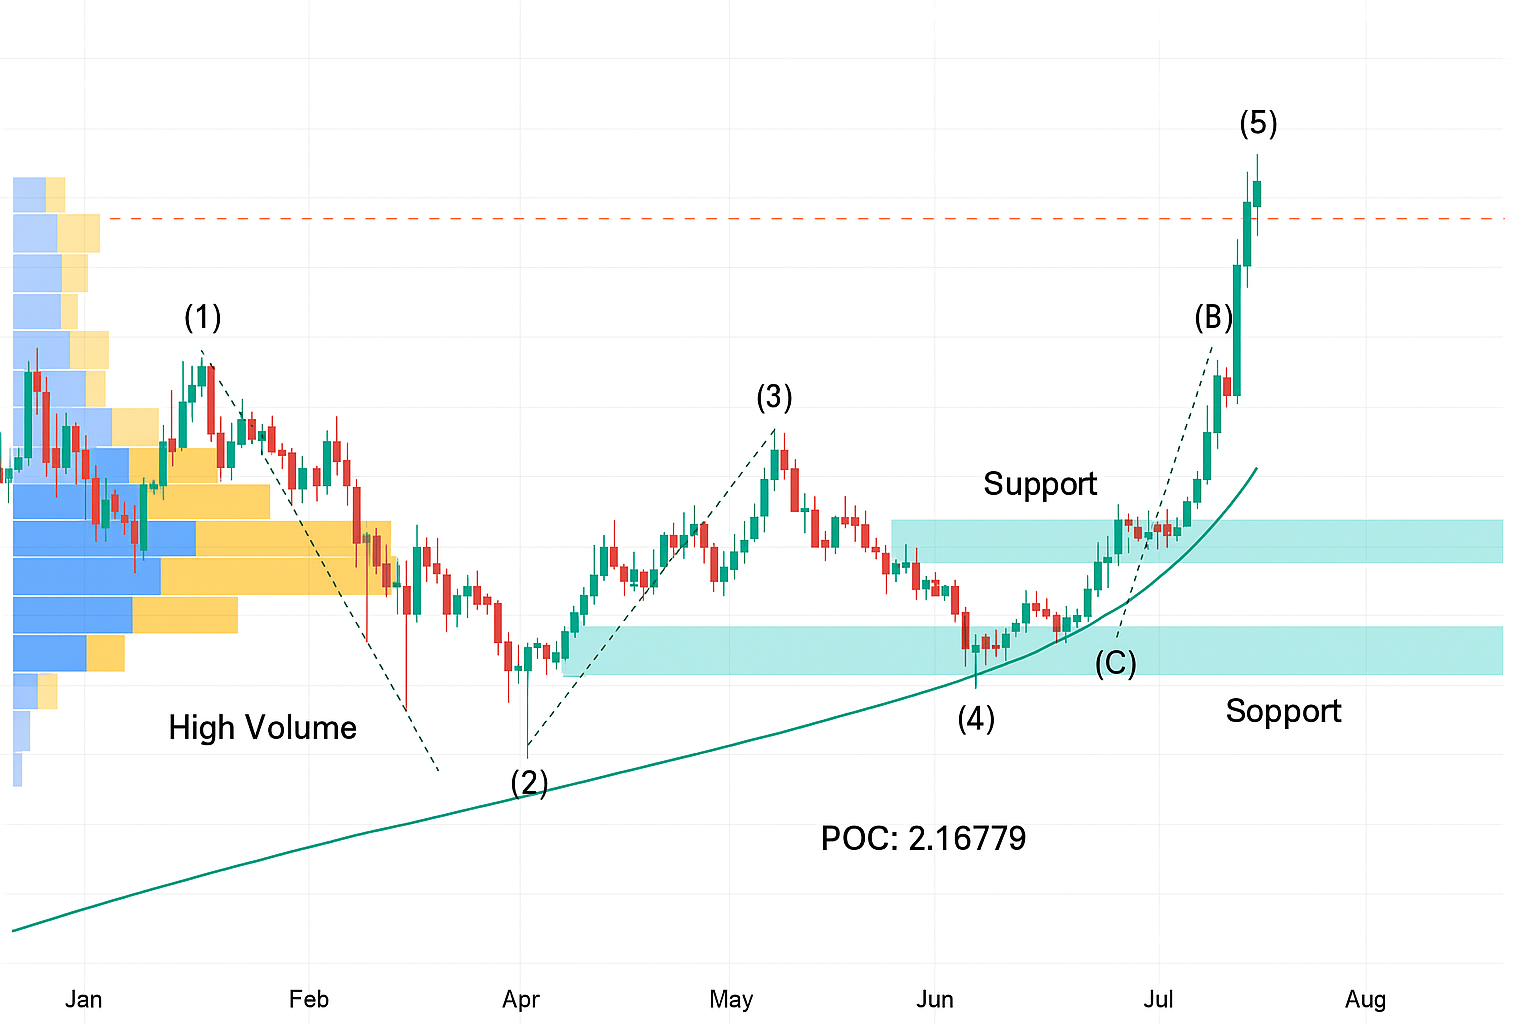
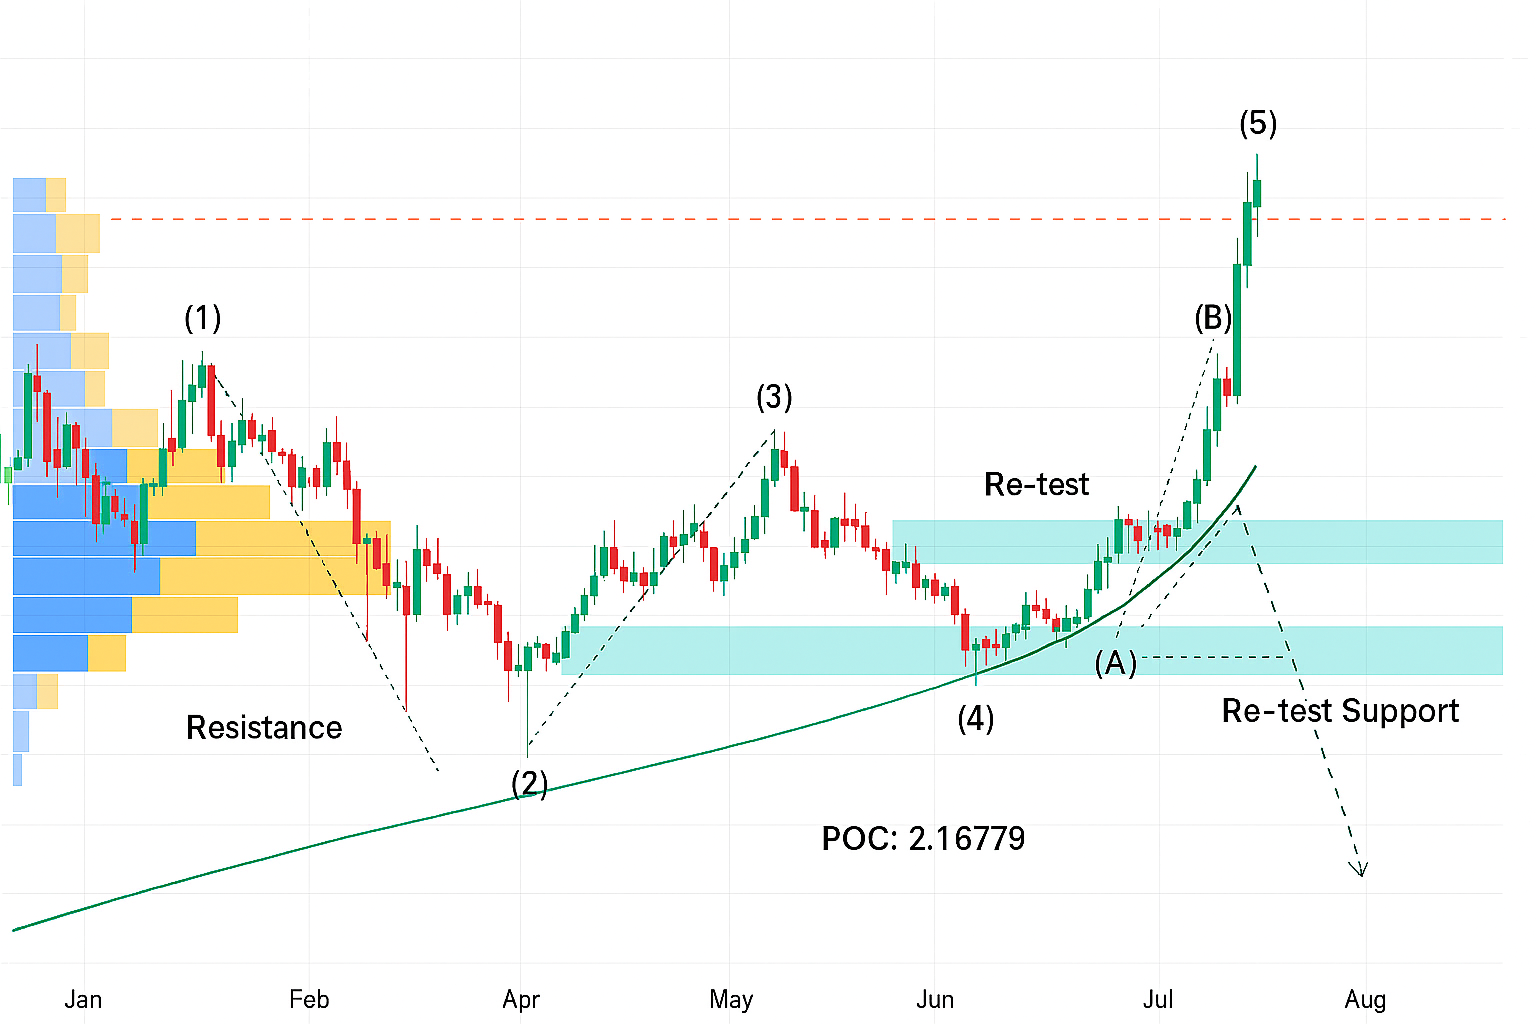
  • Trend: Strong bullish momentum confirmed with a clean Elliott Wave 5-wave impulse completion.
  • Volume Profile (POC): Major volume concentration (POC) is around $2.1679, which is now strong support.


📈 Key Technical Indicators

  1. Elliott Wave Count:
    • Completed a 5-wave impulse (marked in green).
    • Wave 5 has likely peaked (visible at the top-right).
    • Correction (ABC) may follow.
  2. Volume Profile:
    • High activity between $2.20–$2.50.
    • Thin volume zone above $3.00 suggests possible quick retracements or low resistance till $4.00 if breakout continues.
  3. Support Zones:
    • $3.00 – psychological & breakout level.
    • $2.53 – historical resistance now turned support.
    • $2.17 (POC) – very strong structural support.
  4. Resistance Zones:
    • Immediate: Around $3.60–$3.70 (likely wave 5 top).
    • Higher timeframe: Next significant level ~$4.00.


What Might Come Next?

  • Short-term: Expect potential profit booking or wave 5 correction (ABC correction toward $3.00–$2.50).
  • Medium-term: If support holds, it may consolidate before trying another breakout toward $4.00.


⚠️ Watchlist Levels

TypePrice Level
Strong Support (POC)$2.1679
Support$2.53
Current Price$3.5061
Resistance~$3.60–3.70
Breakout Target$4.00+
be57711d-8d85-4410-b58f-bd676d496f99.png


Based on the XRP/USDT daily chart (as of July 20, 2025) and the Elliott Wave structure, here’s the forecast for the upcoming week:


📉 Short-Term Price Action (July 22–26, 2025)

Trend BiasLikely DirectionForecast RangeNotes
📉 CorrectionMild Pullback Expected$3.15 – $3.35Profit booking after wave (5); RSI likely overbought
🧭 Re-test ZoneMajor Support Check$2.85 – $3.00If selling intensifies, look for support zone test
🔁 ConsolidationPossible Sideways Range$3.20 – $3.50If sentiment stays strong, tight consolidation likely

🧠 Technical Basis

  • Wave (5) Completion: Strong 5-wave rally has likely ended at $3.53.
  • Next Expected Move: ABC correction — initial drop (A) already began.
  • High Volume Node (POC): $2.1679 is the major structural support, but unlikely to be hit in 1 week unless breakdown accelerates.
  • RSI / Momentum: Overheated; may push short-term traders to exit positions.

🟢 Bullish Scenario

  • XRP holds above $3.20, buyers defend support.
  • Minor pullback followed by another run-up attempt to $3.80–$4.00.
  • This would confirm wave extension (wave 5 not done yet).

🔴 Bearish Scenario

  • XRP breaks below $3.00 convincingly.
  • Momentum sellers push price toward $2.70–$2.50 (Wave 4 top = key support).
  • May trigger deeper retracement to $2.20 POC zone.

Watch These Levels

Key LevelImportance
$3.53Wave (5) high – resistance
$3.00 – $3.20Weekly support zone
$2.53Strong structural support
$2.17 (POC)Macro support floor
8457d0d0-3a47-4644-8f28-1bb4c01d3cdb.png
Share: