Nifty 50 Weekly Chart Analysis - Week 29, 2025
NIFTY 50 – Daily Chart Analysis (as of July 20, 2025)
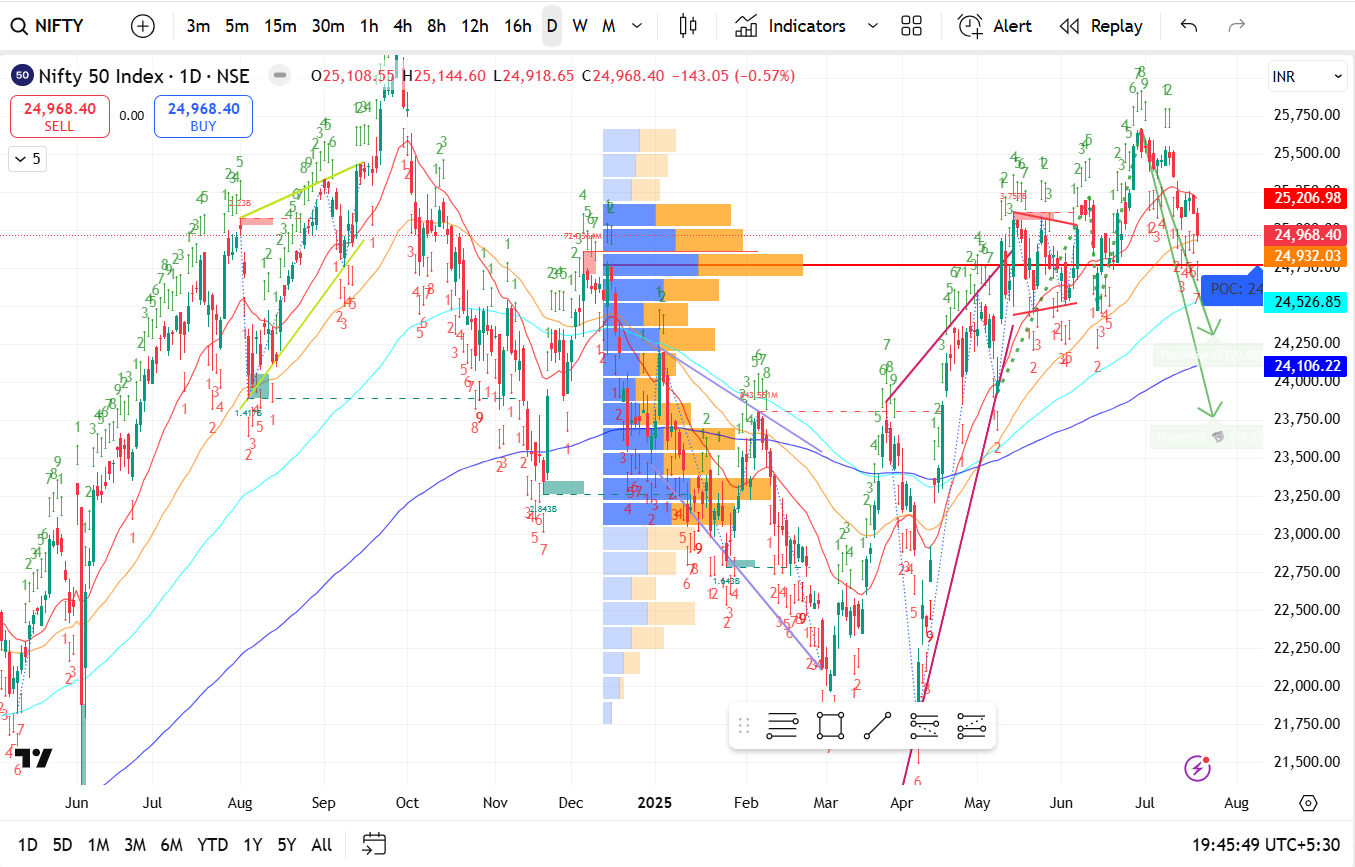
📉 Price Action
- Current Price: 24,968.40
- High/Low of Day: 25,144.60 / 24,918.65
- Daily Change: -143.05 (-0.57%)
- POC (Point of Control): Around 24,526.85
- Volume Profile: Shows highest volume accumulation between 24,400–24,900 zone, indicating a strong demand/supply region.
🔍 Key Observations
1. Trend Structure
- The Nifty formed a double top around the 25,750–25,800 level (June highs).
- Recent price action has been bearish, with lower highs and lower lows forming.
- A clear break below the 20 EMA and nearing the 50 EMA, suggesting weakening momentum.
2. Volume Profile Analysis
- Heavy volume concentration between 24,500–24,900, acting as both support and resistance.
- POC at ~24,526: If broken, a strong selloff could follow.
3. Support & Resistance Levels
- Immediate Resistance:
- 25,206 (20 EMA)
- 24,968 (Current price zone)
- Immediate Supports:
- 24,526 (POC and lower volume shelf)
- 24,106 (200 EMA – significant long-term support)
4. Indicators & Patterns
- TD Sequential Count: Bearish signals visible (red count leading into setup 9).
- Bearish Divergence likely in play as price rallied but momentum waned.
- Price may retest 24,526 and possibly fall toward 24,100 as drawn with the green arrow.
📉 Short-Term Outlook (Next Week)
- Bias: Bearish to Neutral
- If Nifty breaks below 24,526, we may see a fast move toward 24,100–24,000 zone.
- Upside is capped unless we break above 25,200 convincingly with volume.
✅ Strategy Zone
| Scenario | Trigger Level | Action |
|---|
| Breakdown | Below 24,526 | Sell/Short Target 24,100 |
| Reversal/Support Bounce | Around 24,526 | Cautious Long (tight SL) |
| Bullish Reversal | Above 25,200 | Buy with target 25,500+ |
 by Sigbal
