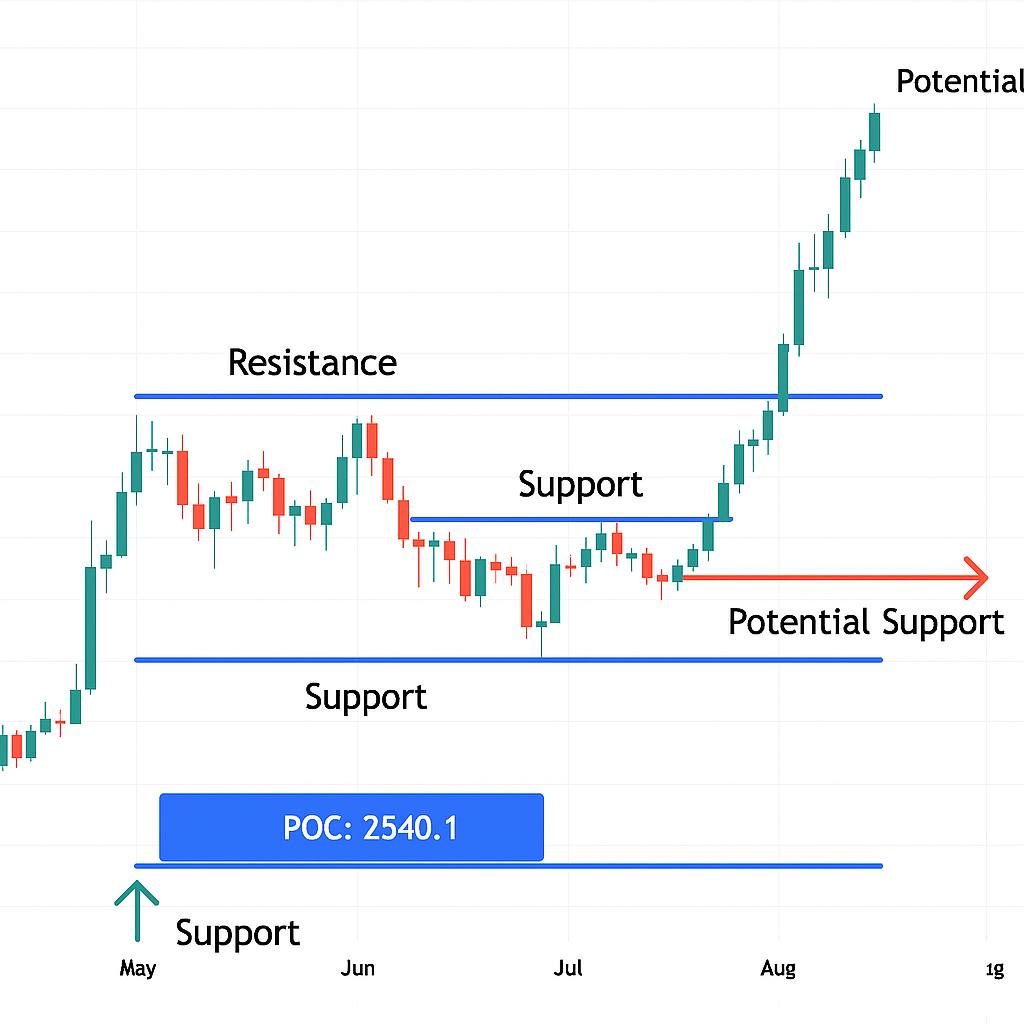
Based on the provided Ethereum (ETH/USD) daily chart from Binance, here’s a quick technical analysis:
📈 Current Price Action:
- Price: $3,772.14
- Change: +4.93% today
- ETH is in strong bullish momentum, clearly breaking out from previous consolidation zones.
🧠 Key Technical Observations:
- Trend:
- ETH is in a steep uptrend since mid-June.
- Multiple green TD Sequential candles indicate continuation of buying strength.
- Support & Resistance Levels:
- Immediate Resistance: None visible nearby (price is in price discovery).
- Support Zones:
- $3,073.20 (last key resistance now turned support)
- $2,762.84 (21 EMA)
- $2,580.63 (Volume profile level)
- POC (Point of Control): $2,540.1 – key high-volume support
- Volume Profile:
- Heavy past activity around $2,540–$2,580
- This zone will act as strong support on any pullback.
- Moving Averages:
- All major EMAs (20, 50, 100, 200) are in bullish alignment.
- No signs of EMA crossover to bearish side – indicates ongoing uptrend.
- TD Sequential:
- Currently showing 9–13 count completed and another 1–9 forming.
- Price could be nearing exhaustion – watch for a short-term pause or retracement.
🔮 Potential Scenarios for Next Week (Week 30):
✅ Bullish Continuation:
- Break above $3,800 with volume could push ETH toward $4,000–$4,200.
- Strong uptrend intact unless price dips below $3,073.
⚠️ Pullback/Correction:
- Short-term retracement to $3,200–$3,073 possible due to overextension.
- If correction deepens, $2,762–$2,580 range is the ideal buy-the-dip zone.
🕵️♂️ Summary:
- Bias: Bullish
- Momentum: Strong
- Near-term Caution: Slight pullback risk after sharp rally
- Long-term View: Accumulation on dips near POC (~$2,540) remains favorable.


