 by Sigbal
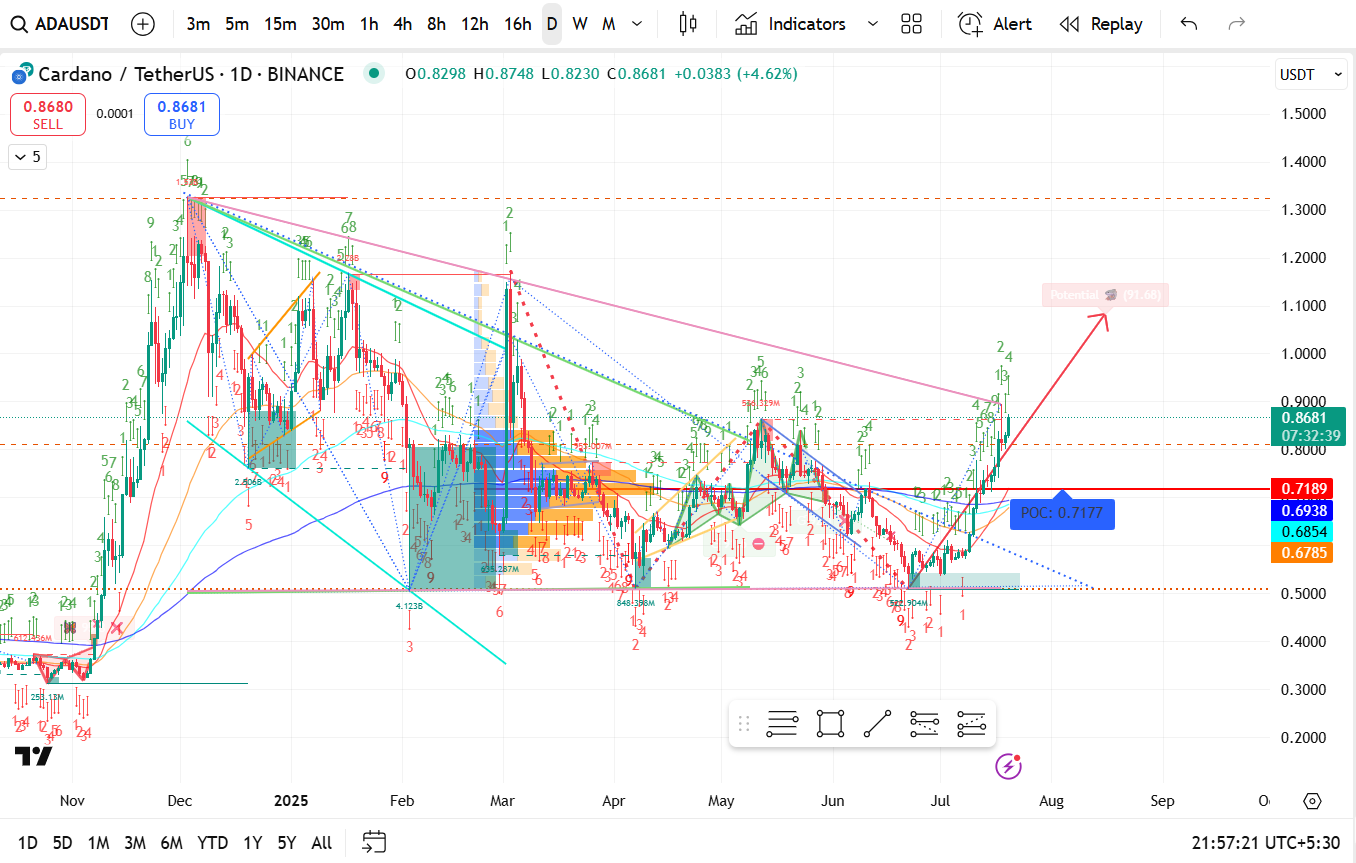
The chart you've provided for ADA/USDT (Cardano) on the 1D timeframe (Binance) reveals some key technical analysis elements. Here's a breakdown of the chart and likely next moves:
Current Price:
ADA is trading at $0.8681, showing a strong daily gain of +4.62%.
Volume Profile POC (Point of Control):
Marked at 0.7177 (blue box).
This is a major support/resistance zone with high traded volume.
Trendlines & Resistance:
Price has broken above the descending trendline from April highs.
Next visible resistance levels:
0.90 - 0.93 (short-term supply zone)
1.00 - 1.10 (psychological + chart-based resistance)
Elliott Wave Count:
Suggests a completed correction and current impulsive wave (likely Wave 3 or 5) in progress.
Green wave count hints at a bullish sequence, with momentum building.
TD Sequential Indicator:
Multiple setups in red and green visible; recent green count reaching 9 suggests a potential exhaustion, but this can extend in strong trends.
Support Levels:
0.7189 (red line): previous resistance, now acting as support.
0.6938 / 0.6854 / 0.6785: minor horizontal supports (blue/orange levels).
POC (0.7177) also adds confluence.
Arrow Projection:
Indicates bullish target toward $1.10, which aligns with the upper consolidation range from Feb/March 2025.
If momentum sustains above 0.86, ADA could target:
0.90 → minor resistance
0.95 - 1.00 → psychological level
1.10 → extended target from previous highs and arrow projection
Immediate risk if price breaks down below:
0.80, followed by POC at 0.7177
Below that, next demand zone is 0.68 - 0.69
| Direction | Probability | Key Levels | Notes |
|---|---|---|---|
| Bullish | High | 0.90 → 0.95 → 1.10 | Strong breakout, Elliott Wave + volume support |
| Neutral | Moderate | 0.86 → 0.80 | Possible sideways pullback |
| Bearish | Low | < 0.7180 | Rejection + high volume reversal |