Chart shows BTC/USDT on the daily timeframe with a high density of technical indicators and annotations. Here's a breakdown of the key elements and what they suggest:
🧠 Technical Highlights:
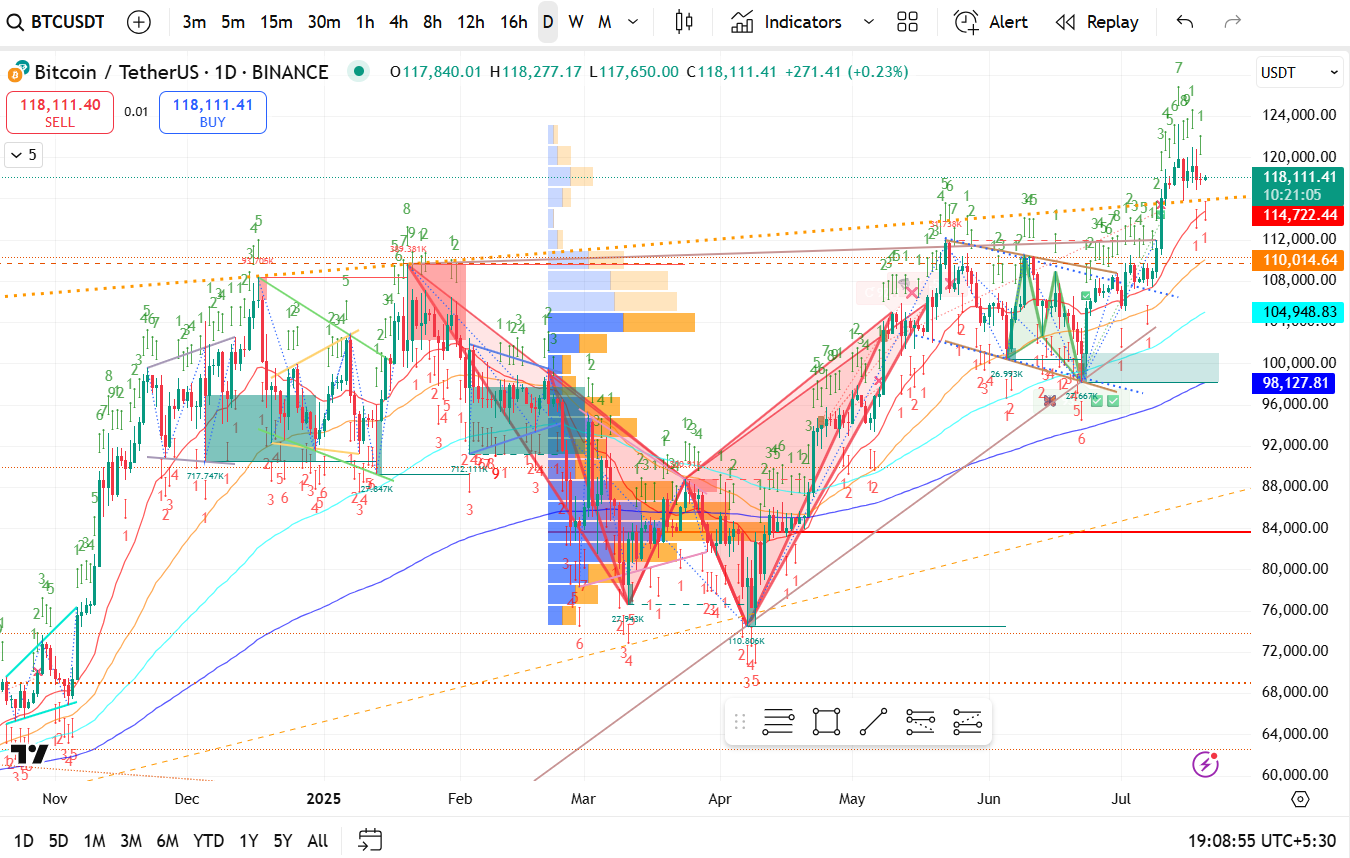
1. Current Price
BTC/USDT: $118,111
Modest green candle today (+0.23%), suggesting a pause or mild continuation of trend.
2. Support & Resistance Zones
Immediate Resistance: Around $120,000 – $124,000
Major Support Levels:
$114,722 (orange line)
$110,014
$104,948
$98,127 (200-day MA – strong dynamic support)
3. Volume Profile (on right)
Highest trading activity occurred around $102,000–$108,000, indicating a strong demand zone below current price.
4. Chart Pattern
Double Bottom/V-Shape Recovery: Seen between March–April
Breakout Rally: Since early July, price has made a higher high above June resistance.
5. TD Sequential Indicator
Multiple green '9's and '13's in recent candles indicate exhaustion of bullish momentum might be approaching soon (potential short-term pullback or consolidation).
6. Moving Averages
Price is above all key MAs (20, 50, 100, 200), showing strong bullish momentum.
200 MA (blue) is flattening upwards, confirming long-term bullish structure.
🔍 Possible Scenarios
✅ Bullish Continuation
If BTC sustains above $114,700, next leg could target $124,000–$128,000 zone.
⚠️ Pullback Risk
TD Sequential exhaustion + resistance at $120k zone could trigger a pullback.
Support zone to watch: $110,000 – $104,000 (could be good dip-buy zone).
📌 Summary
Trend: Bullish
Momentum: Strong but nearing exhaustion (watch for signs of pullback)
Bias: Buy-the-dip above $104k; avoid chasing unless breakout above $120k is confirmed with volume.
Forecast for the upcoming week:
📈 Expected Move: Bullish Continuation with Caution
✅ Base Scenario: Upward Continuation to $120K–$124K
Momentum: Still bullish (price above all major MAs, strong breakout confirmed).
 by Sigbal